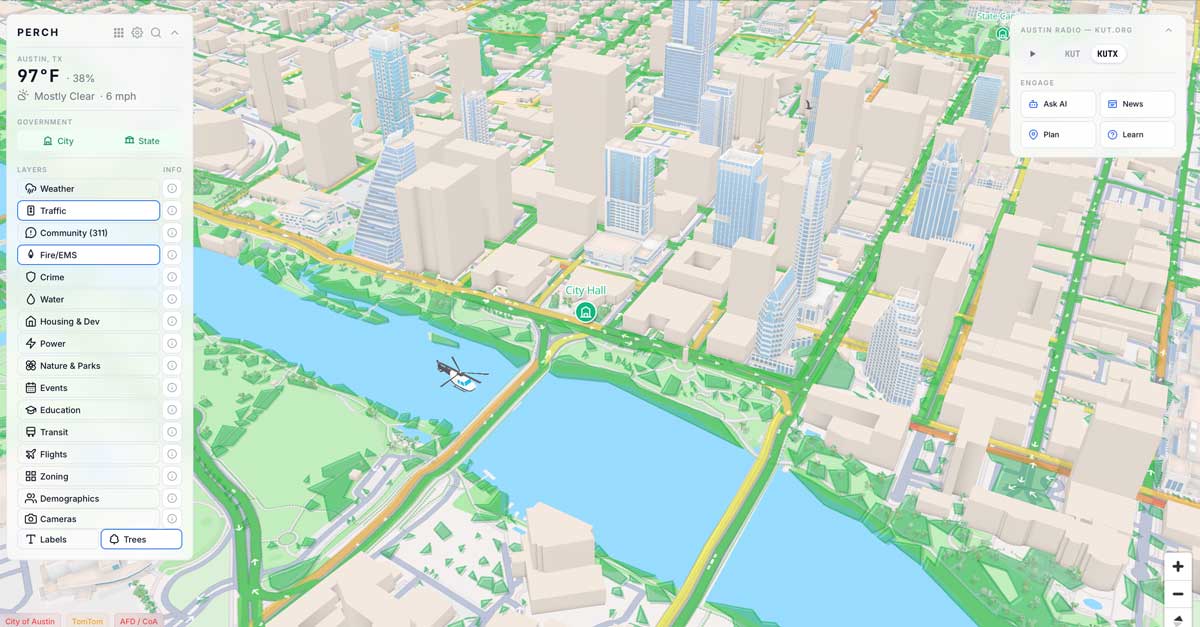
Perch is a living 3D civic dashboard for Austin, Texas. It renders the whole city as an interactive isometric map and layers real-time civic data on top of it — weather, traffic, transit, 311, crime, water, power, housing, parks, and more — so a resident can read the state of their city at a glance.
Perch is my own project, and a long time coming: I've wanted to build a real-life SimCity ever since the game consumed my childhood. I came up through web design — fluent in HTML and CSS, lighter on JavaScript — so a full 3D, data-driven app stayed out of reach for years. Claude Code is what finally made it possible. I design and build it end to end, using the AI-assisted workflow (Claude Code and GitHub) I now use daily as a product developer. The immediate spark was Corpus Day Zero, a drought dashboard I built for the Nueces Basin — Perch is that idea scaled to a whole city.
The interface is a single, continuous 3D model of Austin. A left rail exposes toggleable data layers — Weather, Traffic, Community (311), Fire/EMS, Crime, Water, Housing & Dev, Power, Nature & Parks, Events, Education, Transit, Flights, Zoning, Demographics, Cameras — plus map controls for labels and trees. A City / State toggle switches the level of government in view.
Rather than a wall of charts, the data lives in context: on the streets, buildings, and waterways where it actually happens. The map is the dashboard.
A city already publishes an enormous amount of data — weather, traffic, 311 requests, water, power, permits, crime — but it lives in dozens of separate agency dashboards and open-data portals, each with its own map, login, and learning curve. Even a motivated resident rarely stitches it together. Perch starts from the opposite premise: one place, one map, everything in context.
A few of the decisions behind it:
A lot of Perch is content design, not chart-plotting. Three of its surfaces are generated by Claude, and each only works if it speaks in a single, trustworthy civic voice. For each, I wrote the system instructions, the voice-and-tone rules, and the reference examples that steer the model — then graded the output against them and revised the instructions until it held the voice.
Perch was selected to present at Mapbox BUILD 2026, the company's developer conference — recognition from the platform it's built on that the approach is worth showing to other builders. Development is ongoing, with new data layers and cities on the roadmap.